
Adelaide River
Alice Springs Mulga
Alpine Peatland
Arcturus
Beacon Farm
Boyagin Wandoo Woodland
Calperum
Cape Tribulation
CIA (maize and wheat)
CIA (rice)
Collie
Cow Bay
Cumberland Plain
Daly River Pasture
Daly River Uncleared
Dargo
Dry River
Fletcherview Tropical Rangeland
French Island
Fogg Dam
Gatum Pasture
Gingin
Great Western Woodlands
Howard Springs
Kopuatai
Lauder
Litchfield
Mangawhai
Mitchell Grass Rangeland
Nimmo
Otway
Oxford
Ridgefield
Riggs Creek
Robson Creek
Samford
Scott Farm
Silver Plains
Sturt Plains
Ti Tree East
Tumbarumba
Virginia Park
Wallaby Creek
Warra
Whroo
Wombat
Yanco
Yarramundi
![]() = external link, new window
= external link, new window
Introduction | Contacts | Purpose | Site Description | Measurements | DEM | Footprint | Pictures
Site Description
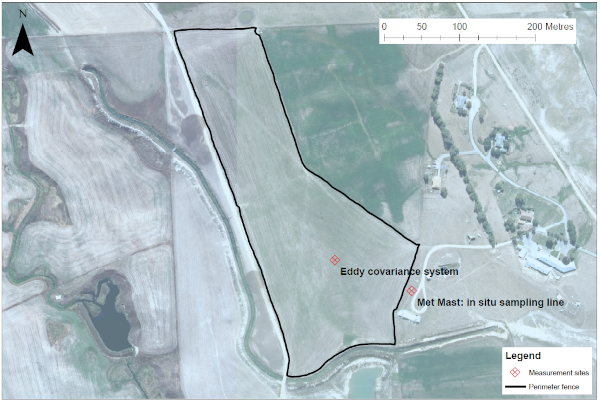
The Lauder Eddy Covariance system (ECS) is in a paddock (6.28 h) of a local farm, adjacent to the NIWA Lauder atmospheric research station, 169°40'49.143" E 45°2'16.004" S, 390 m above mean sea level (figure 1). Lauder is in the Manuherika Valley, Central Otago, New Zealand (figure 2), approximately 37 km north of Alexandra.
Figure 1. Location on Lauder ECS. The paddock is on a privately owned farm. NIWA Lauder atmospheric research station is seen to the right of the paddock. |
Figure 2. a) Central Otago, South Island New Zealand b) Aerial photo of station. Red dot shows the ECS location. |
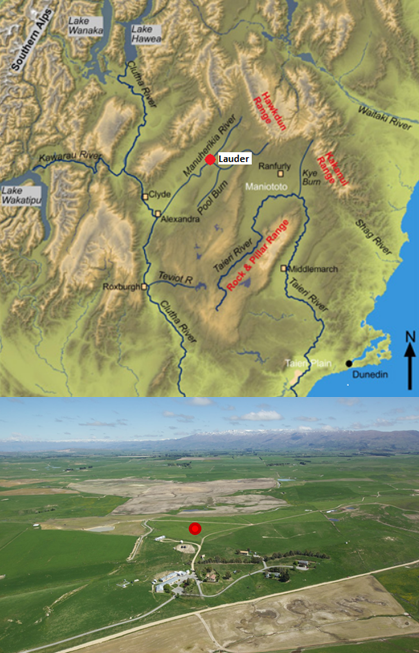
The station consists of a main building complex and subsidiary buildings housing long term experiments (Fig 2b). Locally, the station is surrounded by farmland with seasonal cropping and livestock grazing. Four on-site houses provide accommodation for NIWA staff and visitors. Currently 10 staff work at the station daily. Critical electrical equipment and instruments are connected to a site wide uninterrupted power supply system with diesel generator backup. Instruments are checked daily. With onsite support and backup systems for power failure, instrumentation has minimal down-time compared to remote unmanned stations. The ECS can be serviced near-daily.
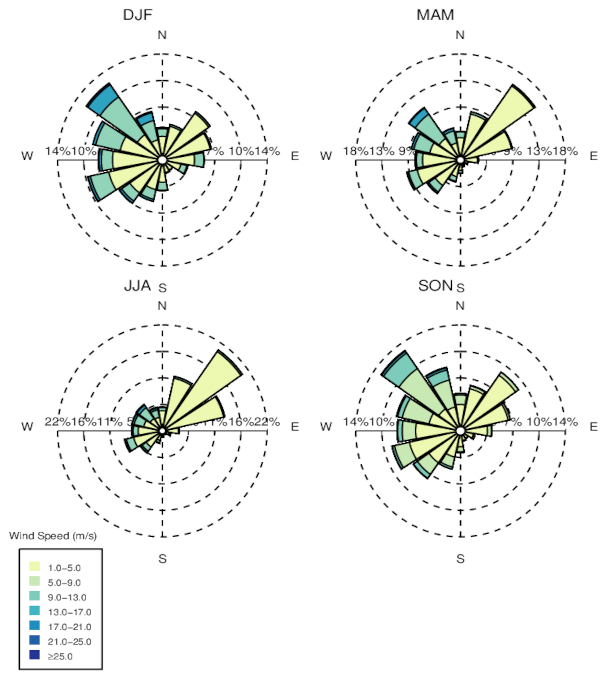
Central Otago is classified as Arid. Lauder climatology 2007-2017 is presented in Table 1. Whilst outside the ECS measurement period it gives a general indication of the climate. Lauder Meteorological data (station agent ID: 5535) was obtained from New Zealand's National Climate Database. The seasonal wind rose diagrams in fig 3. show that the spring (SON) and summer (DJF) months are dominated by westerly wind. Autumn (MAM) and winter (JJA) months is dominated by weaker wind from the north-east caused by cold nocturnal down-valley drainage flow.
| Annual mean rainfall 1997-2023 (mm) | 435.262 |
| Annual mean rainfall standard deviation 1997-2023 (mm) | 97.9361 |
| Month | Rain (mm) | Temp (°C) | Gmin (°C) | Wspd (ms-1) | RH (%) | SMC(%) | GDD (GDD4) |
|---|---|---|---|---|---|---|---|
| Jan | 41.8 (31.4) | 14.9 (5.6) | 16.6 (8.8) | 4.0 (2.9) | 59.3 (21.6) | 13.5 (5.8) | 370 (50) |
| Feb | 45.9 (30.7) | 15.3 (5.8) | 16.0 (8.8) | 3.2 (2.3) | 64.4 (21.6) | 10.7 (3.8) | 319 (30) |
| Mar | 31.8 (24.3) | 13.4 (5.5) | 11.4 (9.0) | 3.2 (2.4) | 64.9 (20.6) | 14.2 (2.6) | 294 (36) |
| Apr | 28.6 (18.0) | 9.7 (5.4) | 8.1 (6.9) | 2.8 (2.2) | 72.1 (18.8) | 13.5 (2.2) | 180 (32) |
| May | 44.6 (19.7) | 6.3 (4.5) | 4.3 (5.3) | 2.6 (2.1) | 77.0 (17.0) | 22.9 (5.6) | 85 (39) |
| Jun | 37.3 (30.8) | 2.4 (4.5) | -0.1 (5.1) | 2.2 (2.1) | 82.9 (15.2) | 37.0 (4.3) | 30 (17) |
| Jul | 19.0 (11.3) | 2.2 (4.8) | 0.2 (5.1) | 2.1 (2.4) | 79.9 (15.5) | 41.0 (2.6) | 36 (20) |
| Aug | 17.0 (16.1) | 5.1 (4.3) | 2.9 (5.7) | 2.5 (2.2) | 75.3 (16.6) | 42.2 (2.6) | 63 (22) |
| Sep | 28.9 (13.4) | 7.8 (4.9) | 5.9 (6.5) | 3.6 (2.9) | 65.2 (19.7) | 38.2 (2.8) | 119 (18) |
| Oct | 35.4 (17.8) | 9.4 (5.0) | 7.6 (8.4) | 4.0 (2.9) | 62.9 (19.4) | 29.3 (4.3) | 171 (31) |
| Nov | 30.8 (29.0) | 12.2 (5.7) | 12.3 (9.6) | 4.0 (2.8) | 59.7 (21.1) | 16.8 (3.1) | 246 (43) |
| Dec | 44.3 (33.7) | 15.0 (5.5) | 16.5 (9.5) | 3.7 (2.6) | 60.2 (21.9) | 12.2 (5.6) | 342 (32) |
Figure 3. Seasonal wind rose diagrams (2007-2017), for summer (DFJ), autumn (MAM), winter (JJA) and spring (SON). |
Geomorphology and soil is hilly rolling valley with semiarid fine sandy loam on clay loam soils (argillic pallic) to a shallow depth (of approximately 45-90 cm). There is moderate drainage and fertility with low profile available water. Topsoil dry bulk density for the region is estimated at approximately 1.2 g/cm3 from S-map, Landcare. Soil samples taken next to the ECS (Farmlands/Hill laboratory, Sept 2019) give a density of 0.9 g/cm3, organic matter at 6.7% and total carbon 3.9%.
Sown paddock vegetation is prairie grass (Bromus willdenowii) aproximately 80%, red clover (Trifolium pratense) approximately 20%. Unwanted weeds, windblown, stock, or prior paddock sowing (less than 5%) is Chickweed, Speedwell, Dandelion, Shepherd's Purse, Lucerne, Festuca and Brown top.
Stocking is low intensity grazed pasture with minimal irrigation and minimal fertilizer application. Most commonly approximately 10 to 20 R2 Heifer cows are sporadically grazed at a time (in a 6.28 ha paddock). Strip grazing during winter is uncommon.
To date, fertilizer has only been applied once, approximately 70 kg/ha Urea.
The paddock has been irrgated since 2023 in summer (irrigation estimates are included in the precipitation parameter within the OzFlux data files).
Supported by

A contributor to

Partner organisations